Ethnobotanical Leaflets 12: 1129-36. 2008.
Molecular Analysis in Rauvolfia tetraphylla L. using RAPD Markers
R. Mahesh*, N. Nirmal Kumar and R. Mary Sujin
Plant Molecular Biology Research Unit,
PG & Research Department of Plant Biology and Biotechnology,
St.Xavier's College, (Autonomous). Palayamkottai - 627 002, Tamilnadu, India.
*e-mail: [email protected]., Tel: 0091- 462 4264374., Fax: 0091- 462-2561765
Issued 01 December 2008
ABSTRACT
The Present study reveals the molecular variations in different accessions of Rauvolfia tetraphylla L. a medicinally important plant collected from five locations of the Tirunelveli hills in Tamilnadu, India. Moleuclar analysis was carried out using RAPD markers. Out of the five primers screened, a total of 27 scorable polymorphic markers were generated. The genetic distance between the population ranged from 0.0770 to 0.3514 and the genetic identity ranged from 0.7037 to 0.9259. The overall observed and effective number of alleles is about 0.5007 and 0.3690 respectively. Nei (1978) overall genetic diversity is 0.2034. It is clear that there is distinct genetic variability in R. tetraphylla L.
Key words: Gene diversity, RAPD-PCR analysis, Rauvolfia tetraphylla L.
INTRODUCTION
Rauvolfia tetraphylla L. (Apocynaceae) is commonly known as “Sarpagandha” a small ever green woody shrub. It is native to West Indies and introduced to India where it is cultivated in gardens in Uttarpradesh, West Bengal, Tamilnadu and Kerala. It has become naturalized in many localities and is distributed in moist habitats in Tamilnadu. Pharmacologically the roots are important although they reportedly contain low concentrations of the alkaloids like Reserpine, Ajmalicine and Tetraphyllicinine possesses hypotensive property and can cure many other diseases (Faisal et al., 2005).
Medicinally the plant extract mixed with castor oil is used in treatment of refractory ailments and bark decoction is used for chronic refractory skin diseases and destroys Parasites (Parrotta, 2001). The root is also used to stimulate uterine contractions and is recommended for use in difficult childbirth cases (Villar et al., 1998).
To understand the effective management of plant genetic diversity from a conservation point of view it is essential to consider variation as richness and distribution at intra and interspecific levels. Depending on the state of our heritable understanding of taxon genetic diversity may be considered at different organizational levels: the genopool, population, individual genome, locus and DNA based sequence (Padmalatha and Prasad 2007).
Randomly amplified polymorphic DNA (RAPD) analysis utilizes single, arbitrary decamer DNA, Oligonucleotide primers to amplify regions of the genome using the polymerase chain reaction (PCR) (Williams et al., 1990).
In the present study was concentrated to determine the genetic variability of R. tetraphylla. L. collected from five locations in Tamilnadu has been carried out using RAPD technique.
MATERIALS AND METHODS:
R. tetraphylla L. samples were collected from five locations in Tirunelveli hills (Table 1.). Five plant specimens from each location were collected. The plant materials were transferred to plastic bags for transport from field to laboratory. Permanent storage was at -70° C. DNA isolation followed by (Uta Pich et al., 1993) and then RAPD analysis (Williams et al., 1990) was carried out.
Table 1. Area of the study of R. tetraphylla. L.
|
Pop ID |
Area of the study |
|
1. |
Manjolai |
|
2. |
Oothu |
|
3. |
Kothayar |
|
4. |
Kuthiraivetti |
|
5. |
Yanai Satumbaloodai |
The amount of DNA and its quality were assessed by UV spectrophotometer. The DNA is pure enough (OD260/280 =1.68), (Sambrook and Russel., 2000) for RAPD- PCR analysis. The reaction mixture used for amplification of DNA given (Table 2).
Table 2. The reagents used to amplify the genomic DNA.
|
S.No |
Constituent |
Quantity |
|
1. |
Sterile water |
13.3µl |
|
2. |
dNTPs |
4.0 µl
|
|
3. |
MgCl2 |
0.3 µl |
|
4. |
PCR Buffer |
2.5 µl |
|
5. |
Primer |
2.4 µl |
|
6. |
Taq polymerase |
0.5 µl |
|
7. |
Plant DNA |
2.0 µl |
|
Total |
25.0 µl |
|
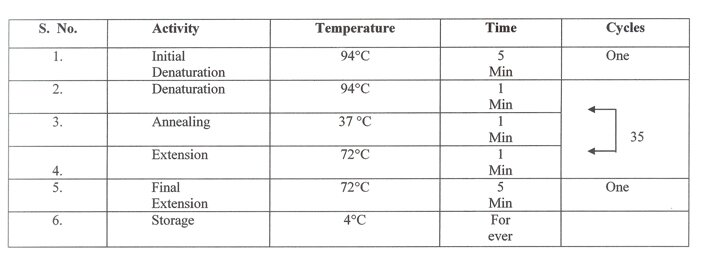
Earlier, eight primers had been tested and five primers which produced reproducible bands were selected. The experiments were repeated three times and confirmed the reproducibility of bands. The reaction steps (Table 3.).
Table 3. The RAPD - PCR reaction steps.
The amplification products were separated by electrophoresis in agarose gel (1.4%). The gel was visualized by UV transilluminator and photographed with gel documentation system Alpha Imager 1200.
Based on the primary data (presence or absence of bands), pair wise genetic distance between samples was calculated using POP GENE package version 1.31 (Yeh et al., 1999).
RESULTS AND DISCUSSION
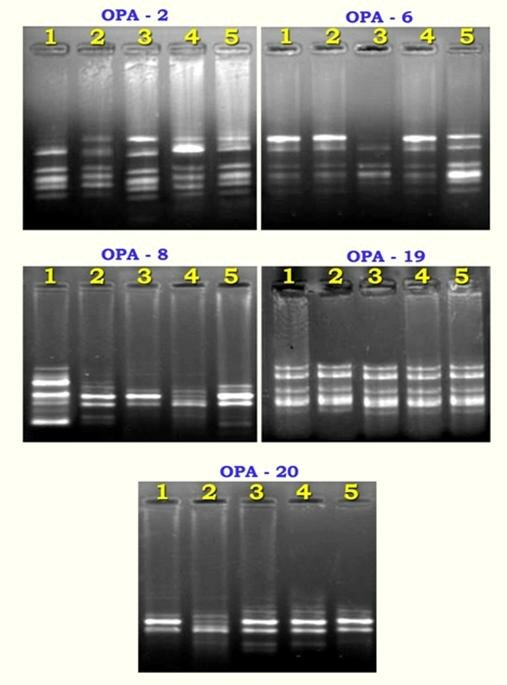
Genetic relationship in R. tetraphylla L. in different locations has been carried out using RAPD markers. Five primers generated reproducible, informative and easily scorable RAPD profiles (Table 4.). These primers produced multiple band profiles with a number of amplified DNA fragments varying from 4 to 7. A total of twenty seven polymorphic bands were observed (Plate 1.). The same type of bands occurred at different frequencies in all populations. There were many additional bands neglected which were not reproducible. The genetic distance between the population ranged from 0.0770 to 0.3514 and the genetic identity ranged from 0.7037 to 0.9259 (Table 5.). The overall observed and effective number of alleles is about 0.5007 and 0.3690 respectively. Nei (1978) overall genetic diversity is 0.2034.
Genetic variation in a population is measured by the heterozygosity or the degree of polymorphism. For the conservation of a species, genetic variability is of the utmost importance to preserve. Genetic variability among all species is important to maintain since it represents the 'blue print' for all of the living things on earth. The result obtained was analyzed in the POP GENE package 1.31 and the dendrogram obtained clearly indicates two clusters (Fig 1. and Table 6.).
Table 4. Oligonucleotides used as random primers and their sequences.
|
Primers |
Sequence 5’-3’ |
Number of Polymorphic bands |
|
OPA 02 |
TGCCGAGCTG |
6 |
|
OPA 06 |
AGGGGTCTTG |
5 |
|
OPA 08 |
GTGATCGCAG |
7 |
|
OPA 19 |
TCTGTGCTGG |
5 |
|
OPA 20 |
AGGTGACGCT |
4 |
The populations of R. tetraphylla L. from the pop 1 and pop 5 and the pop 3 and pop 4 are said to be formed in a separate clad where as other pop 2 get diverged from pop 3 and pop 4. These variations show that the dispersion of the plant has many mysteries in it. The lowest length between the pop 4 and pop 3 is 3.2910. The highest length between the pop 3 and pop 2 is 10.2397 are shown in the (Table 6). From this we can conclude that the population from pop 3 and pop 4 is more diversified where as the population from the pop 1 and pop 2 and also pop 5 are closely related in their dimensions. In the dendrogram based on Nei's genetic distance (UPGMA) obtained (Figure1), the populations were highly differentiated by their own genetic distance.
The clustering results of different accessions suggest that R. tetraphylla L. Undergoes major part of genetic variation by environmental factors. Genetic diversity refers to the variation at the level of individual genes (polymorphisms), and provides a mechanism for populations to adapt to their ever-changing environment.
Genetic diversity is a resource for the species own survival and future evolution, it also promotes selective breeding. The global pool of genetic diversity represents all the information pertinent to all biological structures, functions and processes on this planet. (John De Britto and Mary Sujin 2008). Apart from genetic drift, inbreeding depression may also be one of the factors, which may lead to genetic variation (Sherwin and Moritz, 2000). An understanding of these genetic processes is required in order to fully evaluate the consequences of fragmentation and its relationship to genetic variation. Inbreeding is avoided in all the accessions of R. tetraphylla L. because the plants are dioecious, although within-population gene exchange between plants is unavoidable.
The wide range of variation observed might also be due to two evolutionary forces, which include pollen flow and local selection pressures. Pollen can be dispersed over large distances; this long-term reciprocal movement of pollen must also have contributed to the variation. Recent experiments using pollen traps have shown that oak pollen can migrate at seven kilometers (Lahtinen et al., 1996). The local selection pressures may be due to the effects of environmental factors and due to struggle for existence in nature. The wide spread occurrence of the wind pollination and breeding systems that promotes out crossing may lead to higher genetic diversity.
It is believed that mutations, genetic drift due to finite population size, and natural selection will lead to the genetic diversification of local populations and that the movement of gametes and individuals (gene flow) will oppose that diversification. The lack of gene flow and the effect of genetic drift due to restricted population size might have caused the accessions of R.tetraphylla L. to differentiate genetically among themselves and it is a recently categorized as endangered due to many environmental and anthropogenic influences (Faisal and Anis, 2002).
Although the results of the present study provide evidence for genetic loss, information is required on the implications of reduced genetic variation for survival and fertility. The high degree of genetic variation or differentiation recorded by the transfer of germplasm between different locations should be avoided, to ensure that the genetic material is adapted to local conditions (Ennos, 1998). The genetic analyses presented here could be used for the development of conservation strategies for the species, for example through the definition of appropriate units of management (Newton et al., 1999). In the case where gene flow between neighboring populations is not limited, populations of longer geographical distances will generally show greater diversification.
Hence the grouping of these accessions is independent of the geographical distance. It proved that the accessions collected from different locations exhibited similarities (leaf morphology and length, color of the petiole and midrib, flower morphology and fruit morphology) but their RAPD fingerprinting differed markedly. The more variation, the better the chance that at least some of the individuals will have an allelic variant that is suited for the new environment, and will produce offspring with the variant that will in turn reproduce and continue the population into subsequent generations. In order to prevent depletion of biodiversity due to man-made efforts or otherwise, it is necessary to understand how the diversity of life particularly in the genetic level is maintained under natural conditions. Based on this knowledge one can suggest appropriate strategies and policies for the conservation of biodiversity
An understanding of the genetic diversity responsible for individual species adaptations and responses to their environment (intra specific diversity) is a foundation for understanding almost all ecological and evolutionary processes. Further analysis is necessary to find out the individual polymorphism in each population and to be the best and this data may be correlated with other population and the superior population can be identified. Therefore the difference found in the dendrogram could be partially explained by different number of loci and there coverage of overall genome in obtaining reliable estimation of genetic relationships among the plant species of R. tetraphylla L.
Table 5. Nei's Original Measures of Genetic Identity and Genetic distance. .
|
Pop ID |
1 |
2 |
3 |
4 |
5 |
|
1. |
**** |
0.7407 |
0.7037 |
0.7037 |
0.8519 |
|
2. |
0.3001 |
**** |
0.8148 |
0.8148 |
0.7407 |
|
3. |
0.3514 |
0.2048 |
**** |
0.9259 |
0.8519 |
|
4. |
0.3514 |
0.2048 |
0.0770 |
**** |
0.8519 |
|
5. |
0.1603
|
0.3001 |
0.1603 |
0.1603 |
**** |
Nei's genetic identity (above diagonal) and genetic distance (below diagonal)
Figure 1. Dendrogram Based on Nei's (1972) Genetic distance: Method = UPGMA
(Modified from NEIGHBOR procedure of PHYLIP Version 3.5).
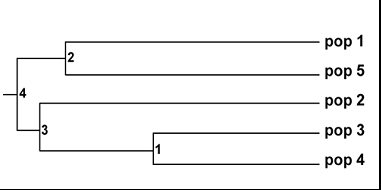
Table 6. The length between the populations.
|
Between |
And |
Length |
|
4 |
2 |
5.51362 |
|
2 |
Pop1 |
8.01713 |
|
2 |
Pop5 |
8.01713 |
|
4 |
3 |
3.29103 |
|
3 |
Pop2 |
10.23972 |
|
3 |
1 |
6.39167 |
|
1 |
Pop3 |
3.84805 |
|
1 |
Pop4 |
3.8480 |
CONCLUDING REMARKS
Therefore analysis of RAPD data could be useful to detect genetic differentiation between six districts of Tamilnadu. However detailed study is desirable to understand all the aspect related to variations. Hence further information is required on patterns of gene flow within and between population, and its effects on reproductive and demographic processes, to assess its impact on population viability.
The high degree of genetic variation recorded that transfer of germplasm between different are as should be avoided, to ensure that the genetic material is adapted to local conditions.
It is important to point out that the genetic variation that a population of organisms possesses is the fuel that allows them to be able to change or evolve in response to changing environmental conditions. Molecular markers are extensively use in genome mapping, diagnosis of diseases and molecular systematic. These are the tools which reveal the mystery of genomes. RAPD markers have recently caught the fancy of many individuals in the field of applied plant breeding. This molecular marker is based on the PCR amplification of random locations in the genome of the plant. With this technique, a single oligonucleotide is used to prime the amplification of genomic DNA. RAPD analysis was done to determine intraspecific variability in R. tetraphylla L. used in traditional medicine in India. The extracts were incorporated into the Indian pharmacopeias, where in addition to being recommended in the treatment of skin conditions such as leprosy, lupus, varicose ulcers, eczema and psoriasis. The result obtained was analyzed in the POP GENE Software 3.1 the dendrogram obtained clearly indicate that there is a clear genetic variability with in this species. This distribution pattern of genetic variation of R. tetraphylla L. populations provides important base line data for conservation and collection strategies for this species.
Therefore analysis of RAPD data could be useful to detect genetic difference between accessions of R. tetraphylla L. However detailed study is desirable to understand all the aspects related to variations. Hence further information is required on patterns of gene flow within and between accessions to protect and select the superior variety of the species.
ACKNOWLEDGEMENTS
The authors are grateful to the Ministry of Environment and Forests, Government of India, New Delhi for financial assistance.
BIBILIOGRAPHY
1. Ennos R.A. (1998). Genetic constraints on native woodland restoration. In: Newton AC. Ashmole P (eds). Native Woodland restoration in Southern Scotland: Principles and practice. Borders Forest trust.Ancrum. Jedburgh. Pp 28-34.
2. Faisal M., Ahmad N. and Anis M. (2005). Shoot multiplication in Rauvolfia tetraphylla L. using thidiazuron . Plant cell tissue org cult 80:187-190.
3. Faisal M. and Anis M. (2002). Rapid in vitro propagation of Rauvolfia tetraphylla L. An Endangered Medicinal Plant. Physiol Mol. Biol. Plats 8:295-299.
4. John De Britto A. and Mary Sujin R. (2008). A study on genetic variability among five cotton cultivars. Indian Journal of Botanical Research. 4(1):29-32.
5. Lahtinen M.J., Pulkinnen P. and Helander M.L. (1996). Potential gene flow by pollen between English Oak (Quercus robur L.) stands in Finland. Forestry Studies. 28: 47-50.
6. Nei (1978). Estimation of average heterozygosity and genetic distance from a small number of individuals. Genetics. 89: 583.
7. Newton A.C., Allnut T. and Gillies A.C.M., Lowe A. and Ennos R.A. (1999). Molecular phyulogeography. Infrspecific variation and the conservation of the species. Trends Ecol. Evol. 14: 140-145.
8. Padmalatha K. and Prasad M.N.V. (2007). Genetic diversity in Rauvolfia tetraphylla L. Using RAPD. Ind.j.Biotech.40 (2):18-22.
9. Padmalatha K. and Prasad M.N.V. (2007). Inter- and intrapopulation genetic diversity of Rauvolfia tetraphylla (L.) Benth.ex Kurz, an endangered medicinal plant, by RAPD analysis. Medicinal and Aromatic plant science and biotechnology. Global science books.
10. Parrota J.A. (2001) Healing plants of Penisular India. CABI Publishers, New York, USA.30:120-125.
11. Sambrook and Russell (2000). Molecular Cloning: A Laboratory Manual. Third Edi. CSHL Press. 78-85.
12. Sherwin W.B and Moritz C. (2000). Managing and monitoring genetic erosion. In: Youn AG. Clarke GM. (Eds.). Genetics. Deomography and viability of fragmented populations. Cambridge University Press. Cambridge. Pp9-34.
13. Uta Pich and Ingo Schubert (1993). Midiprep method for isolation of DNA from plants with a high content of polyphenolics. Nucleic Acids Research. 21(14): 3328.
14. Villar R., Calleja J.M., Morales C. and Caceres A. (1998) Screening of Guatemalan medicinal Plants for platelet antisegregant activity. Phyto. Res. 11:441-445.
15. Williams J.G.K., Kubelik, A.R., Livak K.J. and Rafalski J.A. (1990). Nucleic Acids, DNA polymorphism amplified by arbitrary primers are useful as genetic markers. Nuc. Res.18: 6531-6535.
16. Yeh F.c., Boyle T., Rongcai Y., Ye Z. and Xian J.M. (1999) POPGENE version 1.31-a Microsoft Window based freeware for population genetic analysis, University of Alberta Edmonton.
Plate 1. RAPD banding pattern (OPA Primers) in R. tetraphylla L.